Narrow-linewidth and frequency-stable lasers are nowadays key components in reaching high performances in many domains and applications where the laser interferometry process is involved, like LiDAR, SENSING, METROLOGY, QUANTUM TECHNOLOGIES, ….
The best way to characterize the laser emission frequency is by being able to detect the laser frequency fluctuations, which is done with an OPTICAL FREQUENCY DISCRIMINATION scheme. At SILENTSYS, we propose a plug-and-play OPTICAL FREQUENCY DISCRIMINATOR (OFD) in order to reach a high-performance laser frequency characterization.
We will see here how it is possible to get a lot of information using an OFD: simple, fast, and efficient!
OPTICAL FREQUENCY DISCRIMINATION: DEFINITION
OPTICAL FREQUENCY DISCRIMINATION, or LASER FREQUENCY DISCRIMINATION, is a technique that gives the frequency evolution in the time domain of a single-frequency under-test laser, as we have presented in another article. So, these are methods that convert the laser frequency emission into a readable signal, because, in contrast to electronic oscillators, a laser emits an electric field at a very high frequency, typically around 200 THz for telecom lasers (1.5 µm wavelength).
At SILENTSYS, we are also doing OPTICAL FREQUENCY DISCRIMINATION, that is directly integrated in a few of our products like the OFD (Optical Frequency Discriminator) or the OFC (Optical Frequency Correlator). We provide OPTICAL FREQUENCY DISCRIMINATORS that are small, fast, affordable and available from 400 nm to 2200 nm with a typical working range of 100 nm around the central wavelength.
These are based on modified Michelson or Mach–Zehnder fiber interferometers, with a high vibrations/acoustics isolation, a high-level temperature stabilization (at the microkelvin level), and ultralow noise photodetection in order to reach very good laser frequency discrimination precision.
These products make good candidates for laser frequency characterization, enabling Frequency Noise PSD measurements, Frequency Stability analysis, and Frequency Noise reduction by more than 60 dB to reach a Hz-level laser linewidth from a MHz one.
HOW DOES IT WORK?
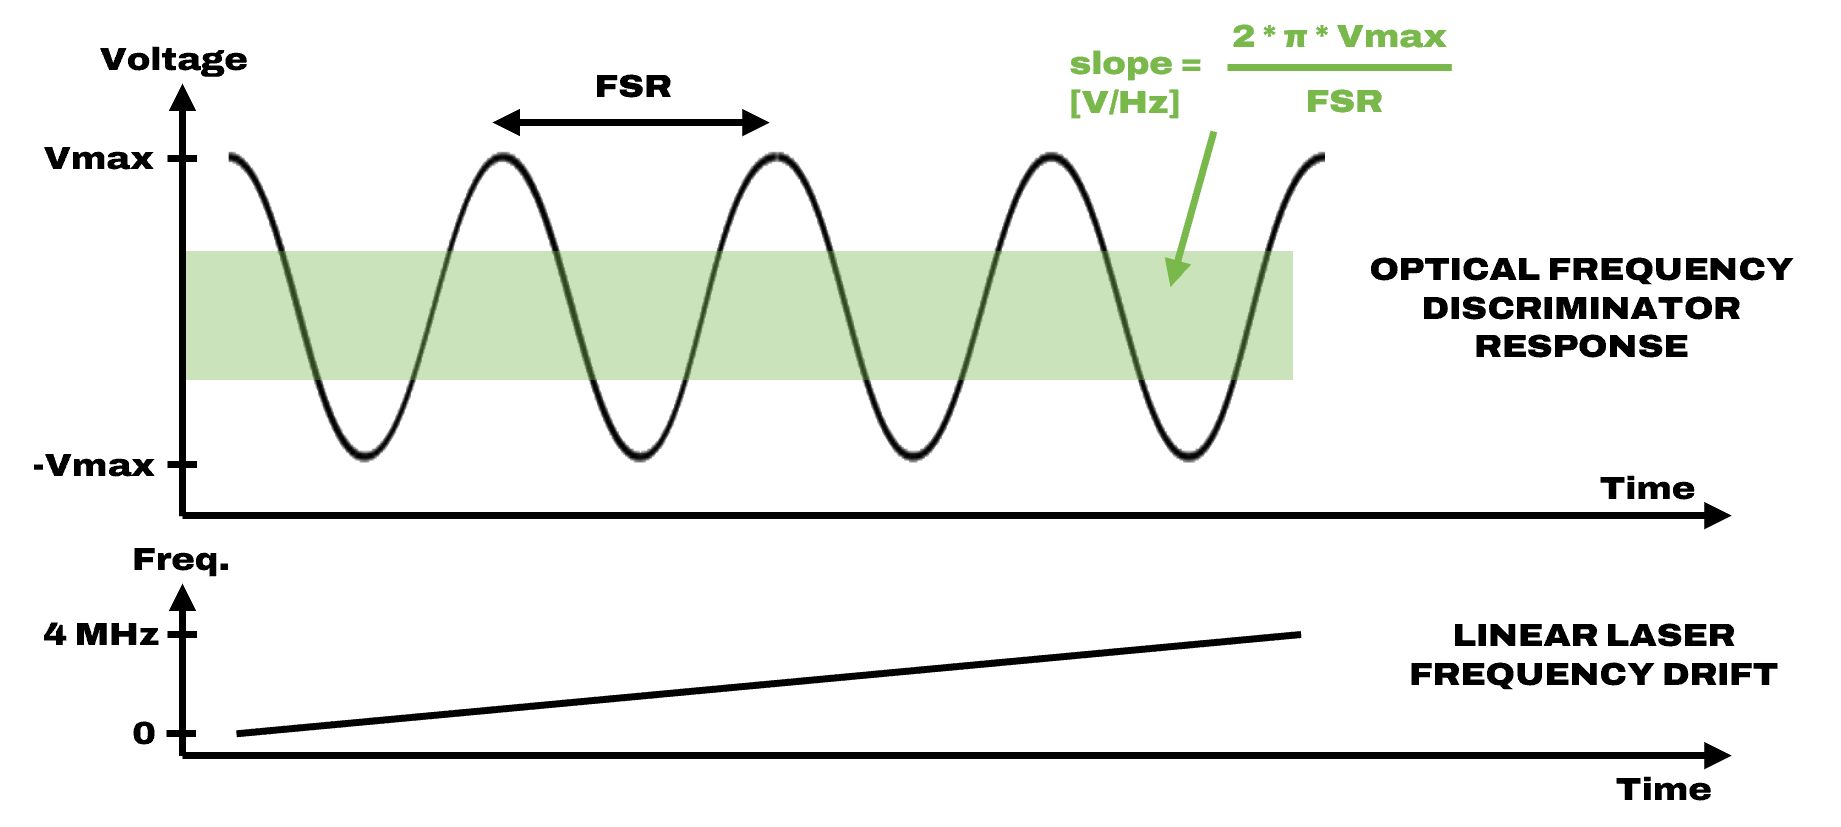
As the SILENTSYS OFD/OFC are based on a modified Michelson or Mach–Zehnder interferometers, so a two-wave interferometric process, the result is a sine fringes pattern against the change of the input laser frequency (as presented in another article). At the middle of one fringe (the green zone in the Figure 1), the conversion between the laser frequency fluctuations and output voltage is linear, so it is then possible to retrieve the laser frequency fluctuations by recording the voltage time trace of the OFD and by knowing 2 important parameters: the amplitude of the fringes (Vmax) and the OFD free spectral range (so the frequency distance between 2 fringes).
In the next figure, as the laser is going through 4 fringes by changing its frequency of 4 MHz, it means that the FSR is 1 MHz in this specific case. The OFD FSR is fixed by construction and can be adjusted between 2 MHz and 2 GHz (other values possible on demand).
LASER EMISSION DIAGNOSTIC USING AN OFD
As the SILENTSYS OFD/OFC are able to give in real time a signal that is linked to the laser emission (frequency and power), we can actually learn a lot about the laser emissions from the time trace characteristics/behavior, as we will show here. For example, just with a quick look at the signal viewed on the oscilloscope (output voltage of the OFD), we can evaluate more than 10 specific cases, such as the instantaneous linewidth of the laser, the slow frequency drift, the optical power/polarization drift, the monomodality, mode-hops, frequency locking quality, ….
Below we present different cases to show how useful an OFD can be for your experiment by better understanding the laser characteristics.
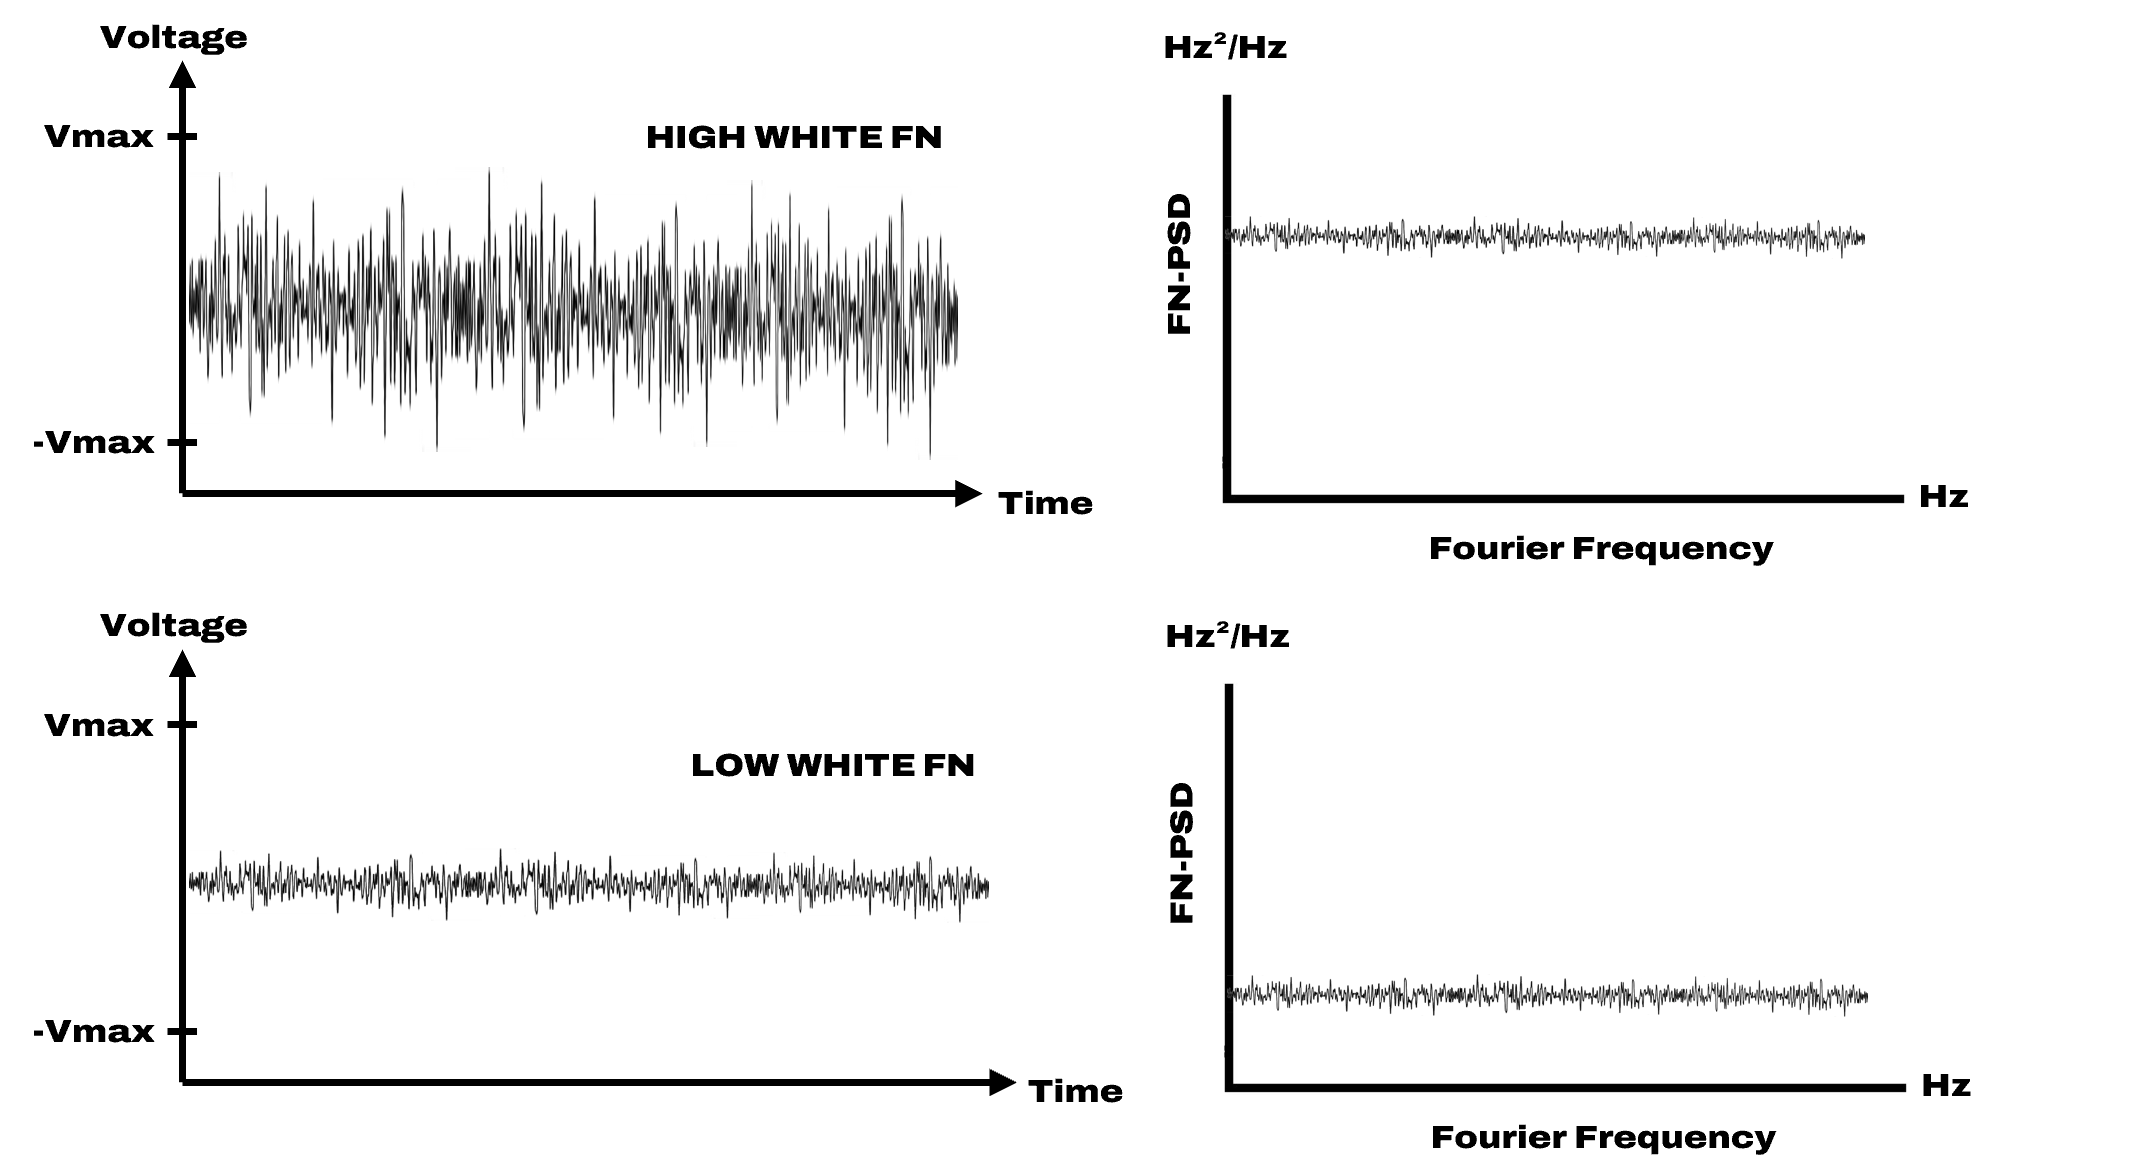
 Case #1 – Laser Instantaneous Linewidth
In this case, the thickness of the curve is directly linked to the white frequency noise of the laser, around 0 V, so at the quadrature point. If the trace is thick, it means a high white frequency noise floor, and if the trace is thin, it means the opposite. However, it is important to not have a low-pass filter to misestimate this contribution. Of course, the thickness of the curve will also depend on the OFD‘s FSR.
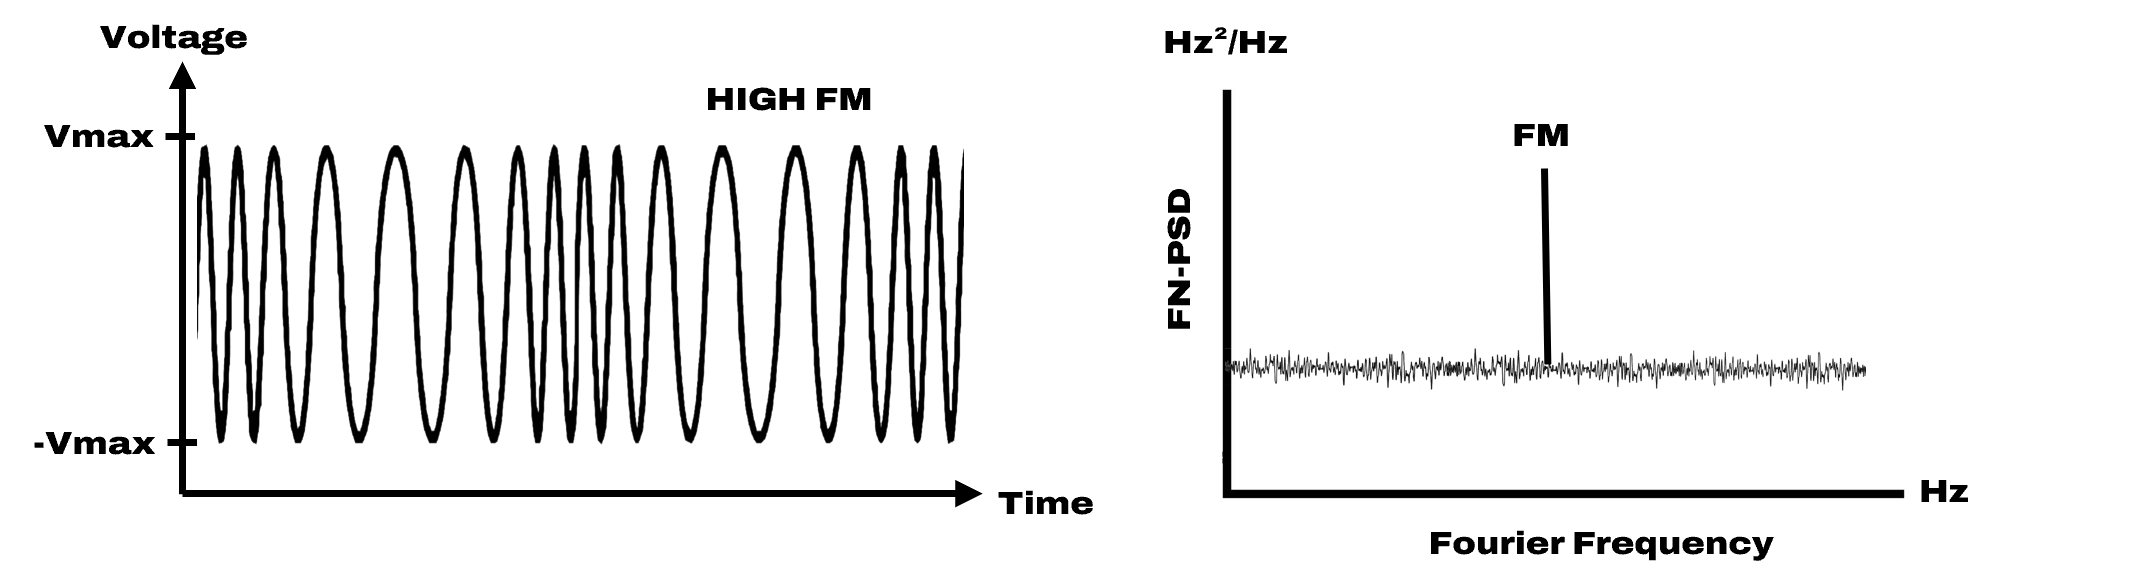
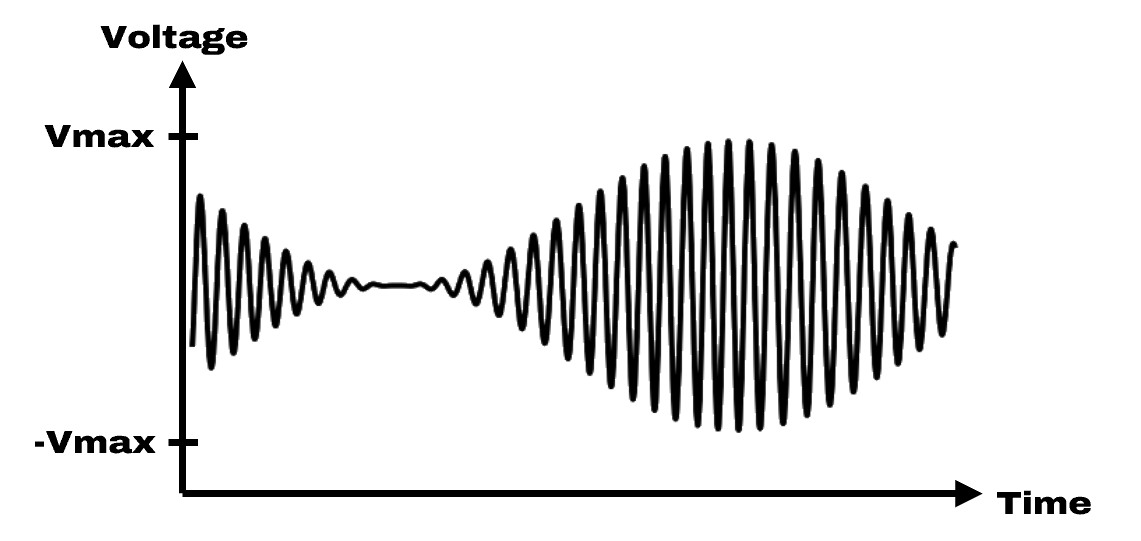
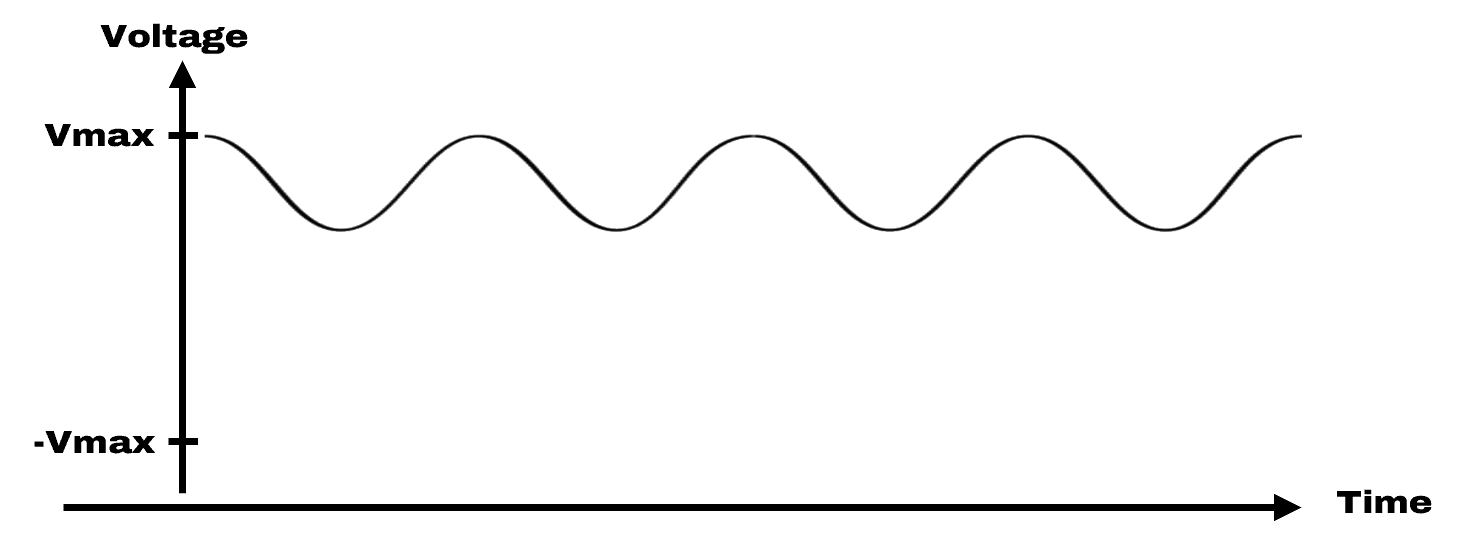
Case #2 – Laser Frequency Modulation
In this case, the fluctuation of the curve will give an important information on the frequency modulation of the laser. If you can observe a sine function (scanning of the fringes), it seems that the laser is highly modulated (at either a fast or slow frequency). Actually, when you are in the case #1, with a thick curve, it is always good to zoom in on the curve to see if there is a sine function, meaning a fast laser frequency modulation. However, in the case of frequency modulation, the signal reaches the maximum/minimum voltage, which is an important data to understand.
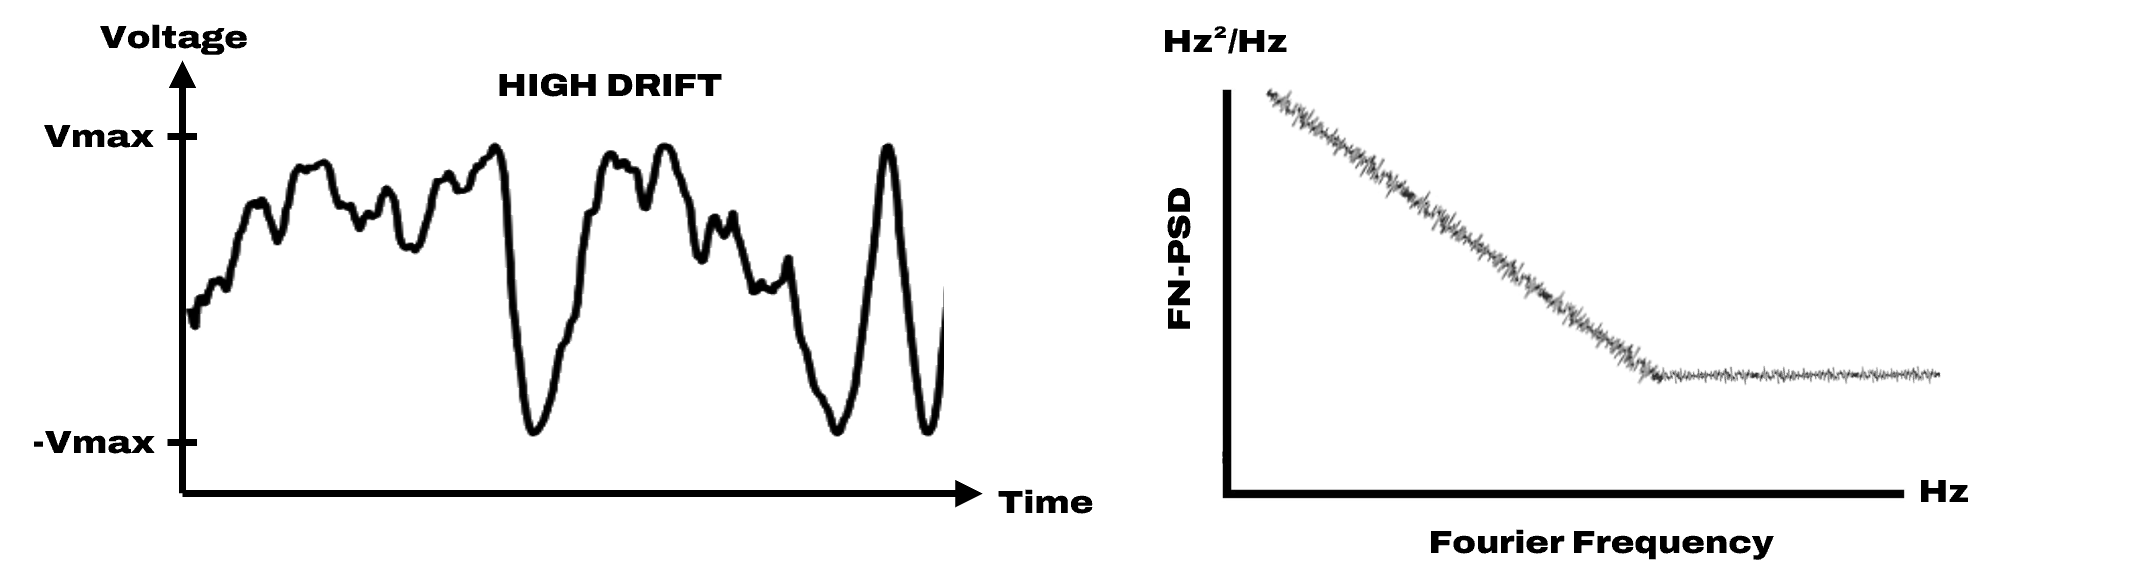
Case #3 – Laser Frequency Drift (ex. Random Walk)
In this case, the fluctuation of the curve will give an important information on the low-frequency contribution of the laser. If you can observe a “random” scanning of the fringes, it seems that the laser is highly affected by noise at low frequencies, by thermal effects, for example.
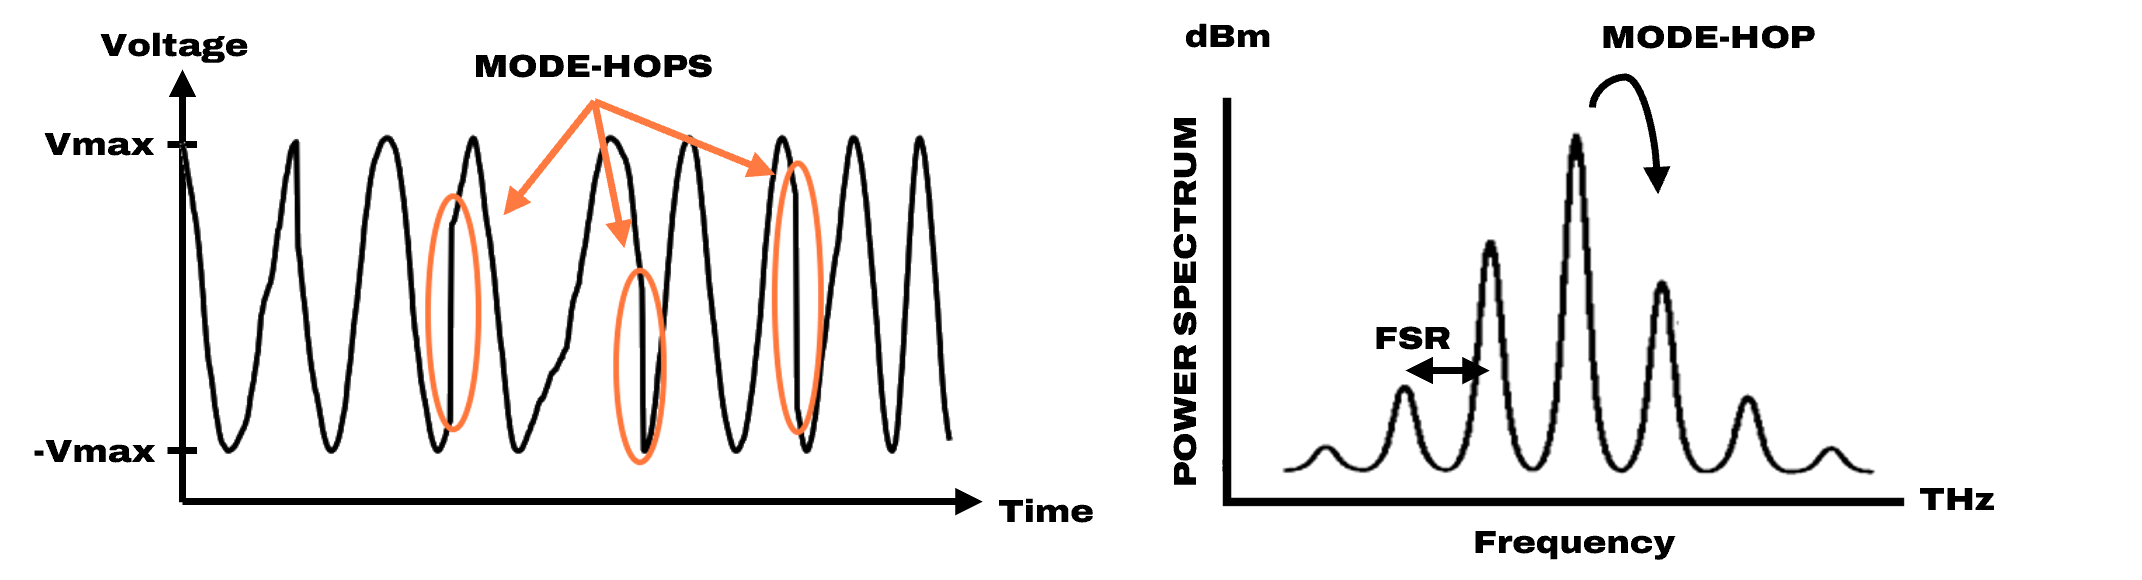
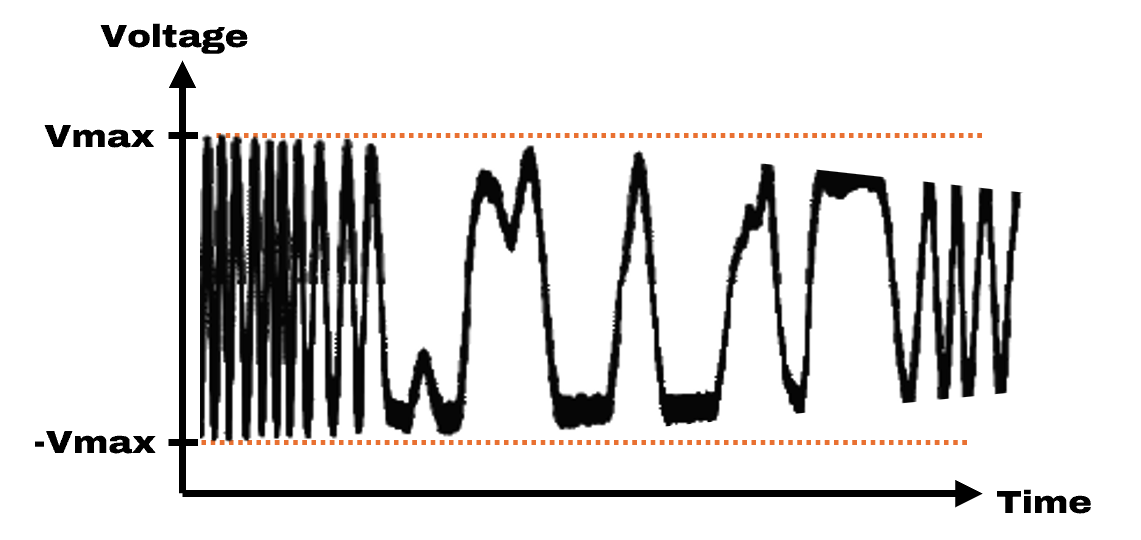
Case #4 – Laser Frequency Mode-Hopping
In this case, the fluctuation of the curve will give an important information on the laser frequency jumps, also called mode-hops. This is easily visible and is not a good sign. It means that the laser is probably affected by back-reflections and creates an external cavity that is very long and unstable, with very low FSR (MHz domain). With this configuration, active laser frequency locking is not recommended and probably not robust. An external cavity with back-reflections also causes “artificial” white frequency noise reduction that can underestimate the real laser frequency noise.
Case #5 – Laser Polarization State
In this case, the fluctuation of the curve will give an important information on the laser polarization state. Usually, the OFD needs linear polarization at the input and is not fast-axis blocked. So, the polarization of the laser needs to be aligned to the slow axis of the PM fiber. However, if the polarization is not well aligned to the slow axis, this will cause interferences on the fringes, which we can observe easily by changing the OFD temperature. So, to properly use the OFD, the polarization should be linear with the highest extinction ratio (we recommend minimum 18 dB) and on the slow axis. The use of a polarizer can help.
Case #6 – Laser Power Fluctuations
In this case, the fluctuation of the curve will give an important information on the laser power fluctuation. This can be very close to what is observed in case #5. The best way is to measure at the same time the laser output power to be sure which phenomenon it is. However, a laser power fluctuation can be problematic because it will affect the Vmax and –Vmax, so it will affect the discrimination factor….
Case #7 – Unstable Laser Frequency When Locked: Breathing
In this case, when the laser is locked actively, we do not observe a nice flat and stable line but a signal that is like breathing. Most of the time, this means that, even if the laser is locked by acting onto an electrical actuator (for example, the current of a semiconductor DFB laser), it is still affected by optical back-reflections (if badly isolated) and there is a competition between the electrical and optical lock.
But using a better isolated laser, or by better isolating the laser, this can solve this issue.
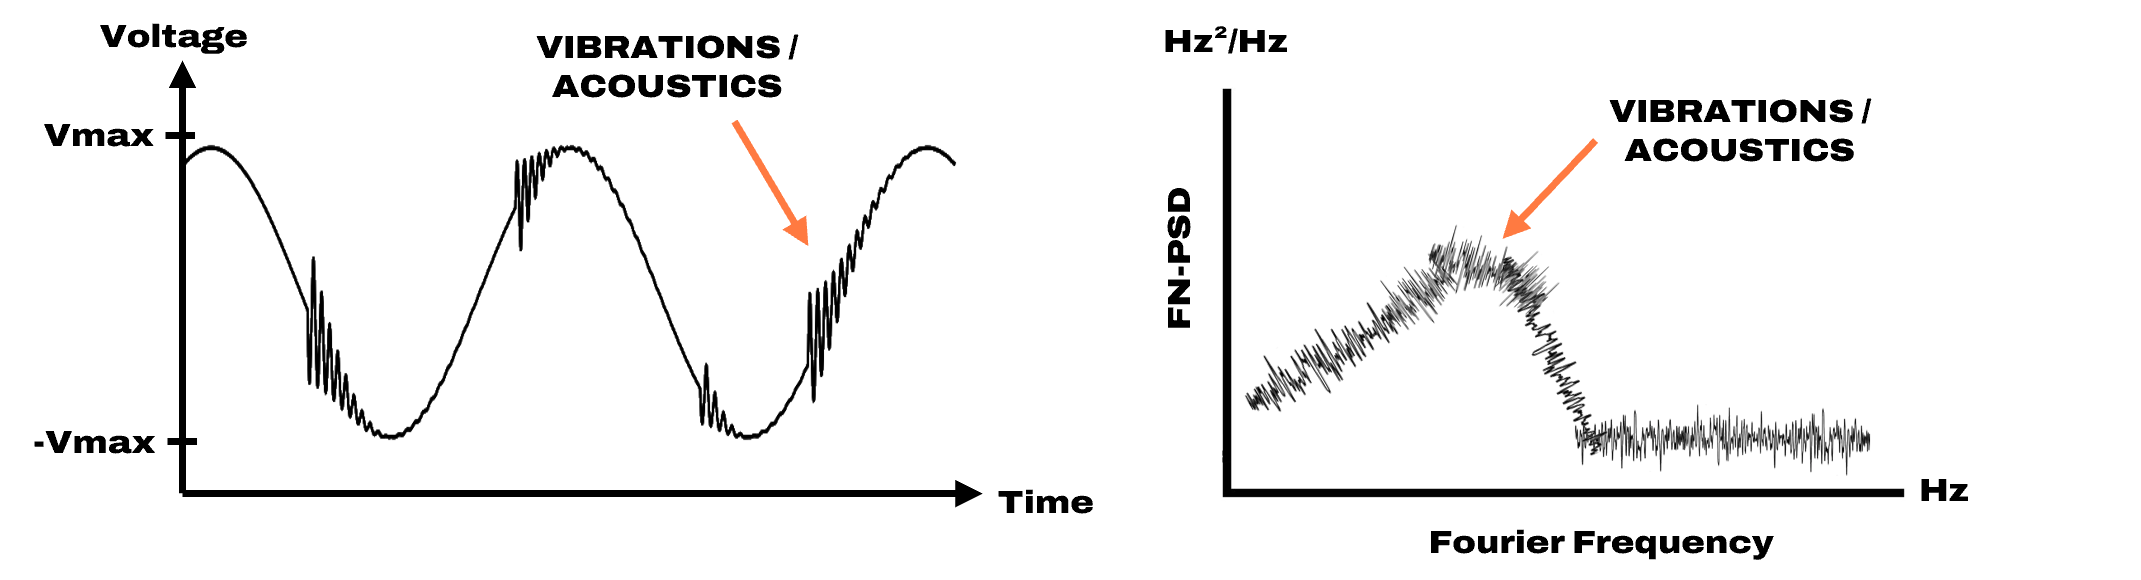
Case #8 – Vibration and Acoustic Laser Sensitivity
In this case, like any laser, it is sensitive to the environment and especially to the vibrations and acoustics. When the laser is vibrating, the cavity length changes and this changes the emission laser frequency. This is observable directly on the output signal of the Optical Frequency Discriminator to evaluate rapidly (or also very accurately) the vibration/acoustic sensitivity of a laser. Especially, ECDL (external cavity diode lasers) will be highly sensitive as they usually are highly tunable.
It is so amazing to just blow on a laser or clap hands to see how the laser reacts!
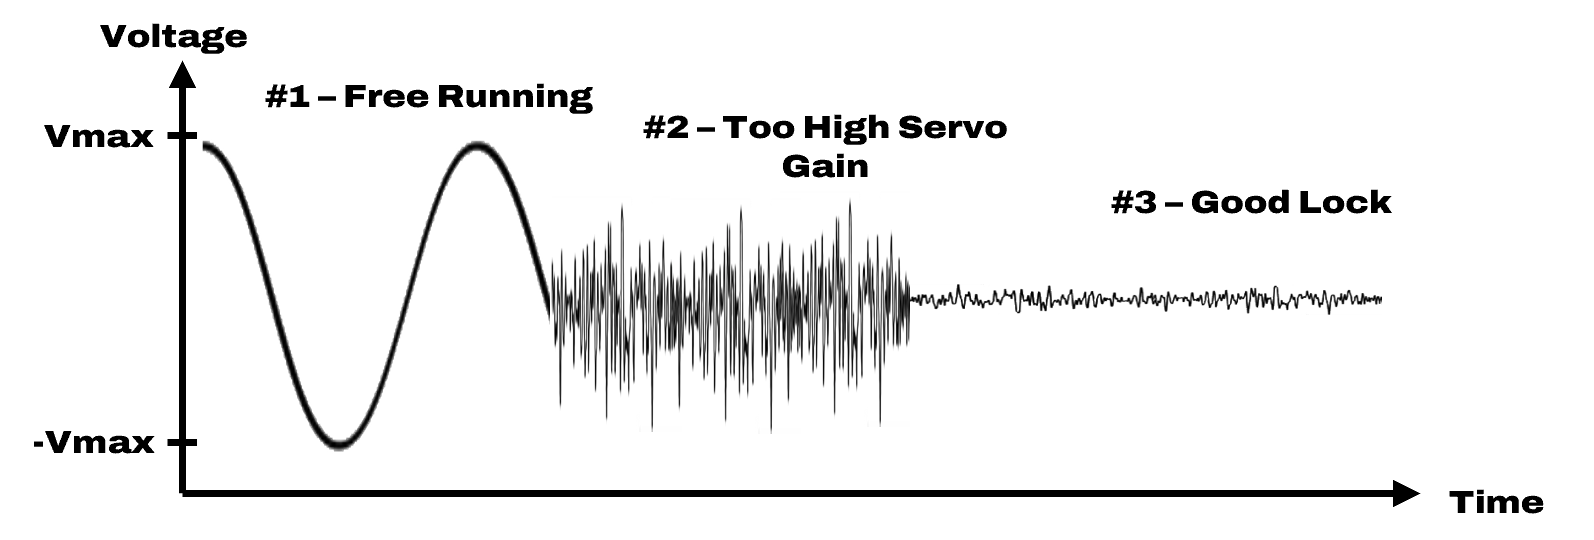
Case #9 – Frequency-Locked Laser
In this case, we can easily evaluate if a laser is correctly frequency locked by locking first on the time trace. When the laser is free-running, the frequency will randomly (or not) change over time (#1). When it is locked, but with too much servo gain, the signal is highly oscillating (#2). When the laser is correctly locked, the signal is thin and stable (#3) and around 0 V if it is in-loop.
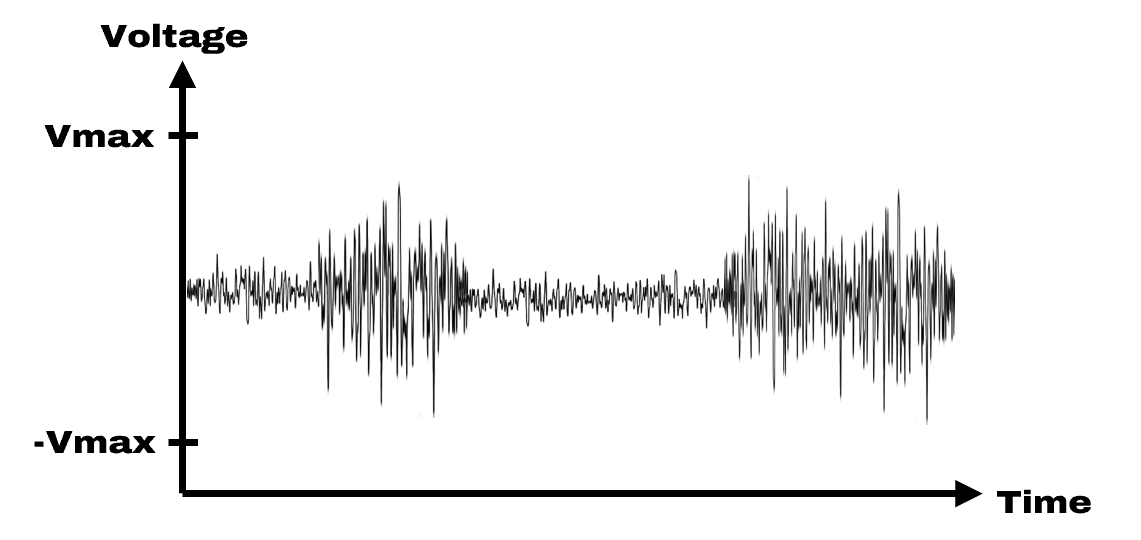
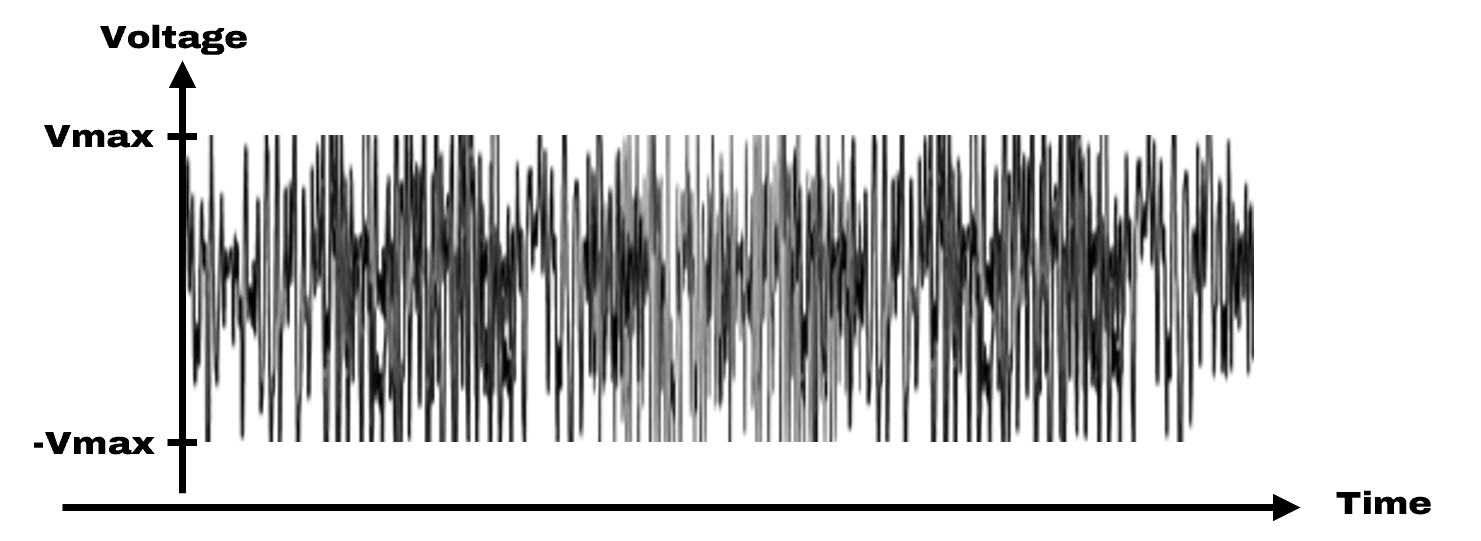
Case #10 – Highly Multimode Laser (or Very High White Frequency Noise, or just ASE)
In this case, if the laser is highly multimode or with a very high white frequency noise floor (related to the instantaneous linewidth) or incoherent light like amplified spontaneous emission (ASE), what we see on the time trace is just a big noise, symmetric, and centered around 0 V usually.
Case #11 – No Signal at the OFD Output
In this case, if the laser is not too powerful, if the input fiber connector is dusty/damaged, if the internal photodiode is damaged, or if the laser wavelength is very out of the working range, no signal can be seen. However, in the case of a very stable laser (and with a bit of luck), the signal can also be close to 0 V and very tiny. In that case, it is good to change a bit the OFD temperature to see if the signal changes (for example, with fringes that appear).

Case #12 – Asymmetric Signal
In this case, if the signal you observe is totally asymmetric, this can be due to at least two effects. The first effect is that the internal OFD can be damaged (fiber or photodetector). The second possible reason is that the laser wavelength is too far from the working range of the OFD. In that case, the laser frequency noise measurement or locking is still possible but not recommended.
Case #13 – Laser with a High Level of Intensity Noise
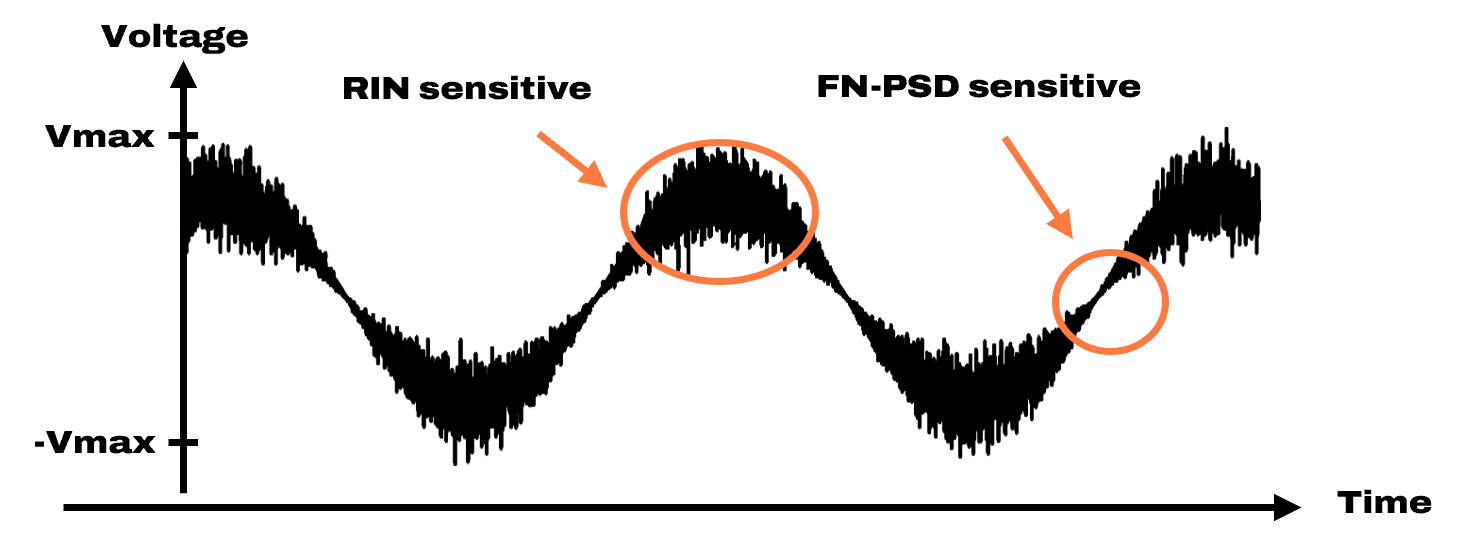
In this case, we can easily detect if the laser presents a relatively high intensity noise. Indeed, the OFD has been developed to have low sensitivity to the laser intensity noise close to 0 V (where it is highly sensitive to the laser frequency noise), and due to its architecture, it is highly sensitive to the intensity noise at the Vmax and –Vmax (where it is not sensitive at all to the laser frequency noise).
So, if the trace is thicker close to +/− Vmax and thinner around 0 V, this gives the information that the laser intensity noise is not very good. This effect is more visible with an OFD with high FSR because the conversion factor between the frequency and voltage noise is lower.
That is also why when making a FN-PSD measurement, it is important to be as close as possible to 0 V.